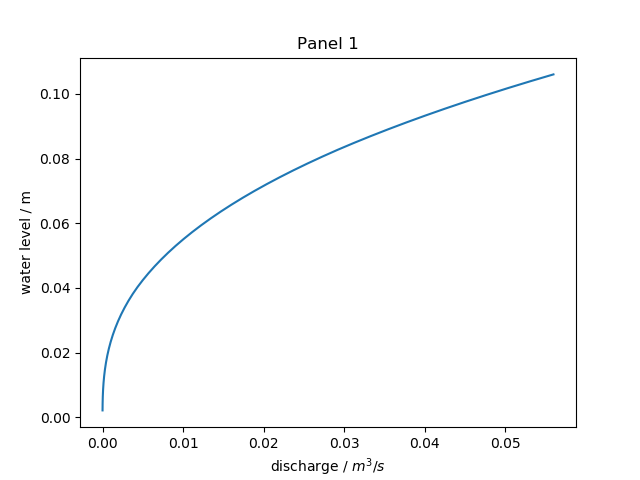
Figure 3.1: Rating curve for the right hand panel of the top boundary.
Next: Demos, Previous: Invoking slope.py, Up: Top [Contents][Index]
The values of discharge and height calculated by the makeBoundary program are based on a one-dimensional analysis of friction loss in channels. The formulae applied are Manning’s equation and the continuity equation. A summary of the background theory is given in the Fluvial Design Guide1 published by the Environment Agency.
In makeBoundary the one-dimensional analysis is implemented in a series of steps. The first step identifies the number of regions, or ”panels”, that make up the boundary. The markers at the start and end of each panel are listed in the boundary definition file (see Boundary Definition File). In the next step the minimum and maximum heights are established for each panel. The minimum height is the height at the bottom of the channel. The maximum height is the height at which overtopping starts to occur.
The next step is to generate a rating curve for each panel. The rating curve relates the discharge Q to surface elevation h for the steady flow condition. The discharge is defined by the continuity equation:
Q = A V
where A is the cross-sectional area of the flow and V is the flow velocity. For the case of channel flow, V is given by Manning’s equation:
V = (1/n) R2/3 S1/2
where n is the Manning coefficient of roughness, R is the hydraulic radius and S is the friction slope. The hydraulic radius is the ratio of the cross-sectional area A to the wetted perimeter of the channel P. The friction slope is taken to be equal to the slope of the channel bed for the case of steady flow.
It is convenient to introduce the term conveyance to directly relate the discharge to the slope. The conveyance K is given by the expression
K = A (1/n) R2/3.
Discharge and slope are then related by the expression
Q = K S1/2.
In order to generate data for the rating curves the conveyance and discharge are calculated for a set of water levels for each panel. The set of levels spans the range between the minimum height and the maximum height. At each level the wetted perimeter and the cross-sectional area are calculated. From these values the hydraulic radius is calculated, allowing the conveyance to be determined. Finally, the discharge is calculated from the conveyance.

Figure 3.1: Rating curve for the right hand panel of the top boundary.
An example rating curve is shown in Figure 3.1. The data for this curve was generated from the topography and boundary definition file provided in the demo directory.
Together, the rating curves establish the connection between water level and discharge at the boundary. The makeBoundary program identifies the panels that are filled and the panel that is part-filled. The discharge in the part-filled panel is set so that the sum of the discharge values is equal to the target flow. The last step is to interpolate the water level from the rating curve of the part-filled panel.
Next: Demos, Previous: Invoking slope.py, Up: Top [Contents][Index]